Auditors were spending more time navigating the system than doing the actual audit.
50 auditors. 30 minutes lost per audit. Auditors reported 10 to 20 properties delayed for mapping every day, pushing the overall backlog higher. No one had scoped a fix yet. I did.
Auditors were losing up to 30 minutes per audit to a system that wasn't designed for how they actually worked.
The existing workflow forced auditors to piece together information from multiple disconnected views. A property overview lived in one place, access point details in another, and there was no way to filter by the dimensions each team actually cared about. Auditors reported 10 to 20 properties being delayed for mapping daily as a result, compounding the backlog over time.
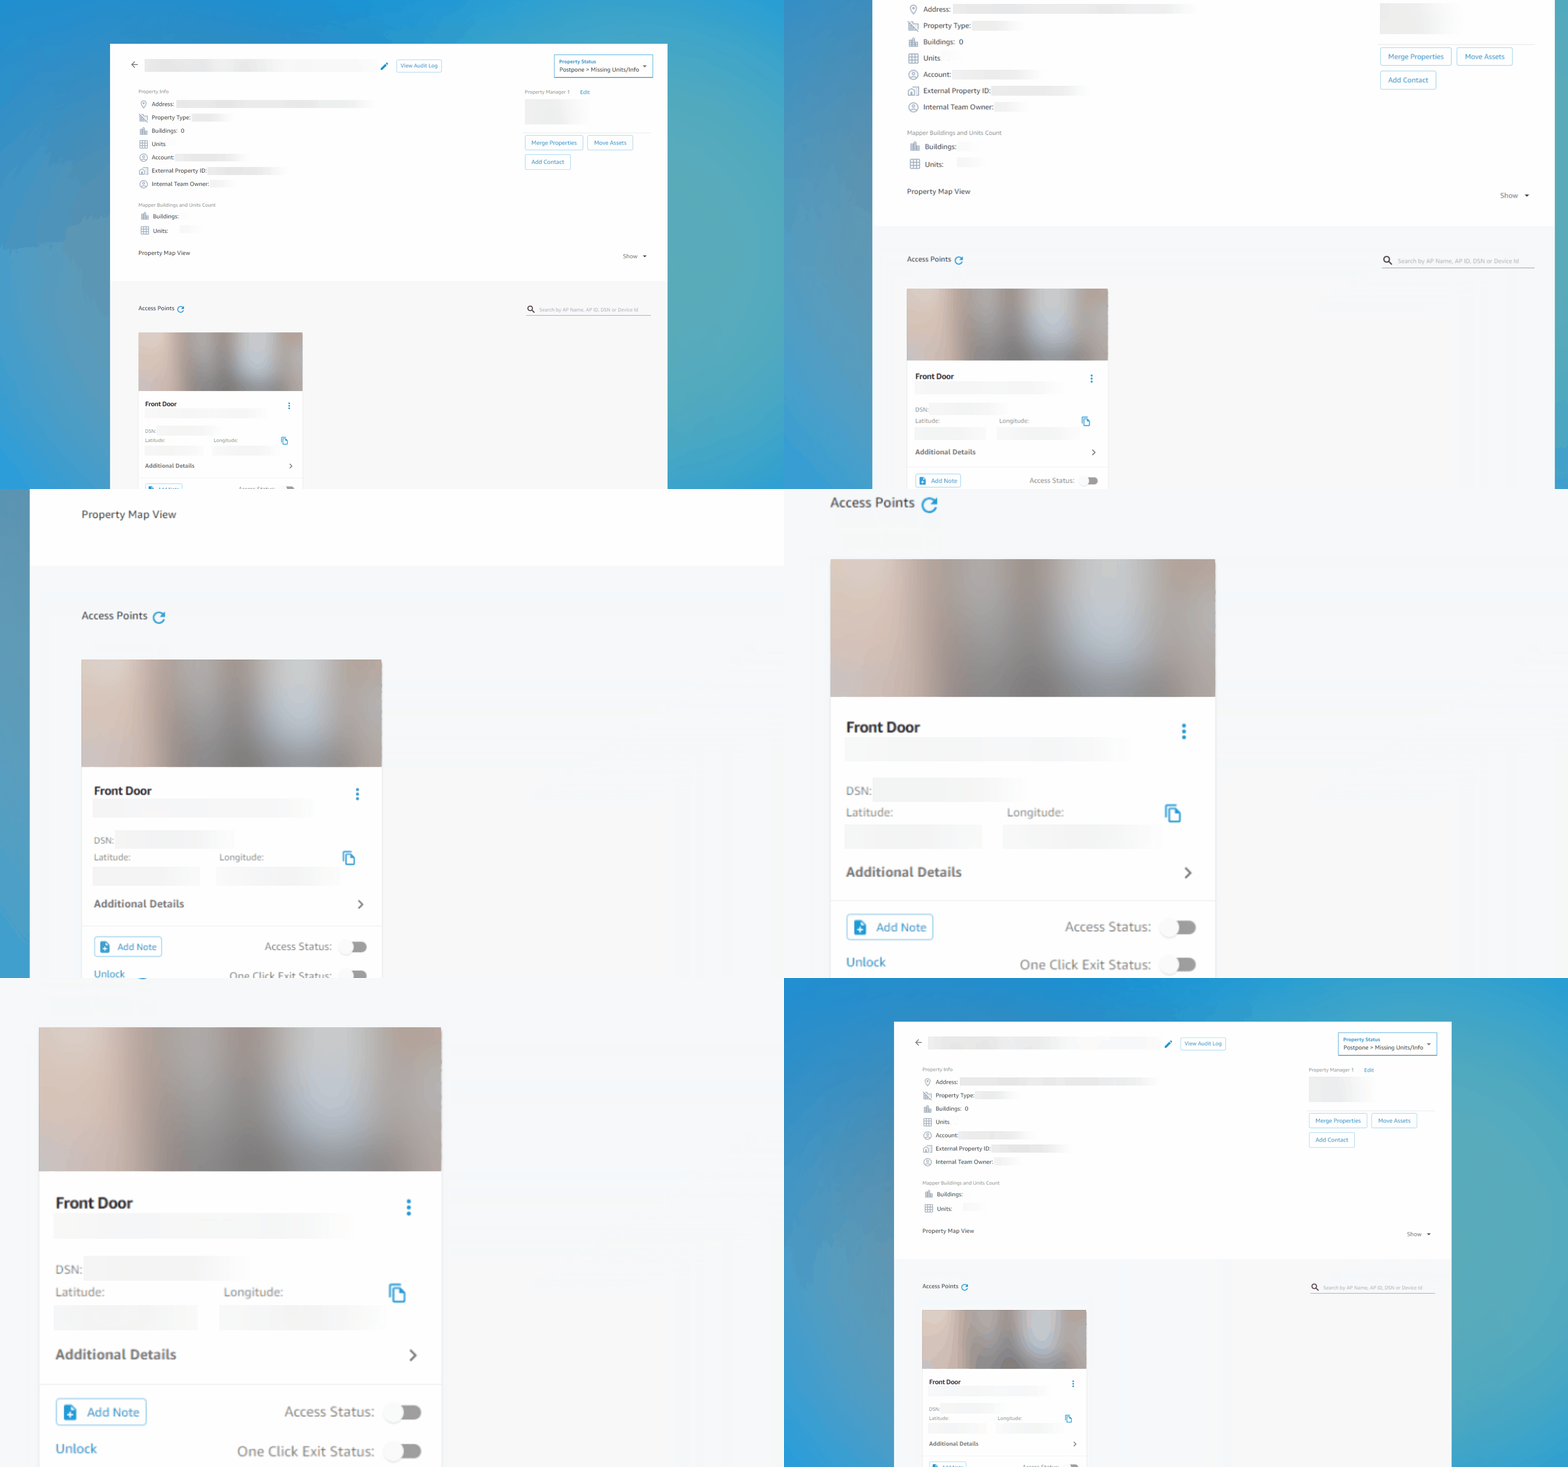
The auditor starts on the property landing page, navigates to the access points section, then opens each collapsed access point card individually, repeating this sequence for every single audit.
Four problems, one broken mental model.
Auditors need to scan, assess, and act. The interface made them dig instead. Every friction point traced back to the same root cause: the tool was built around data structure, not around how auditors actually move through a task.
I identified the problem before anyone asked me to solve it.
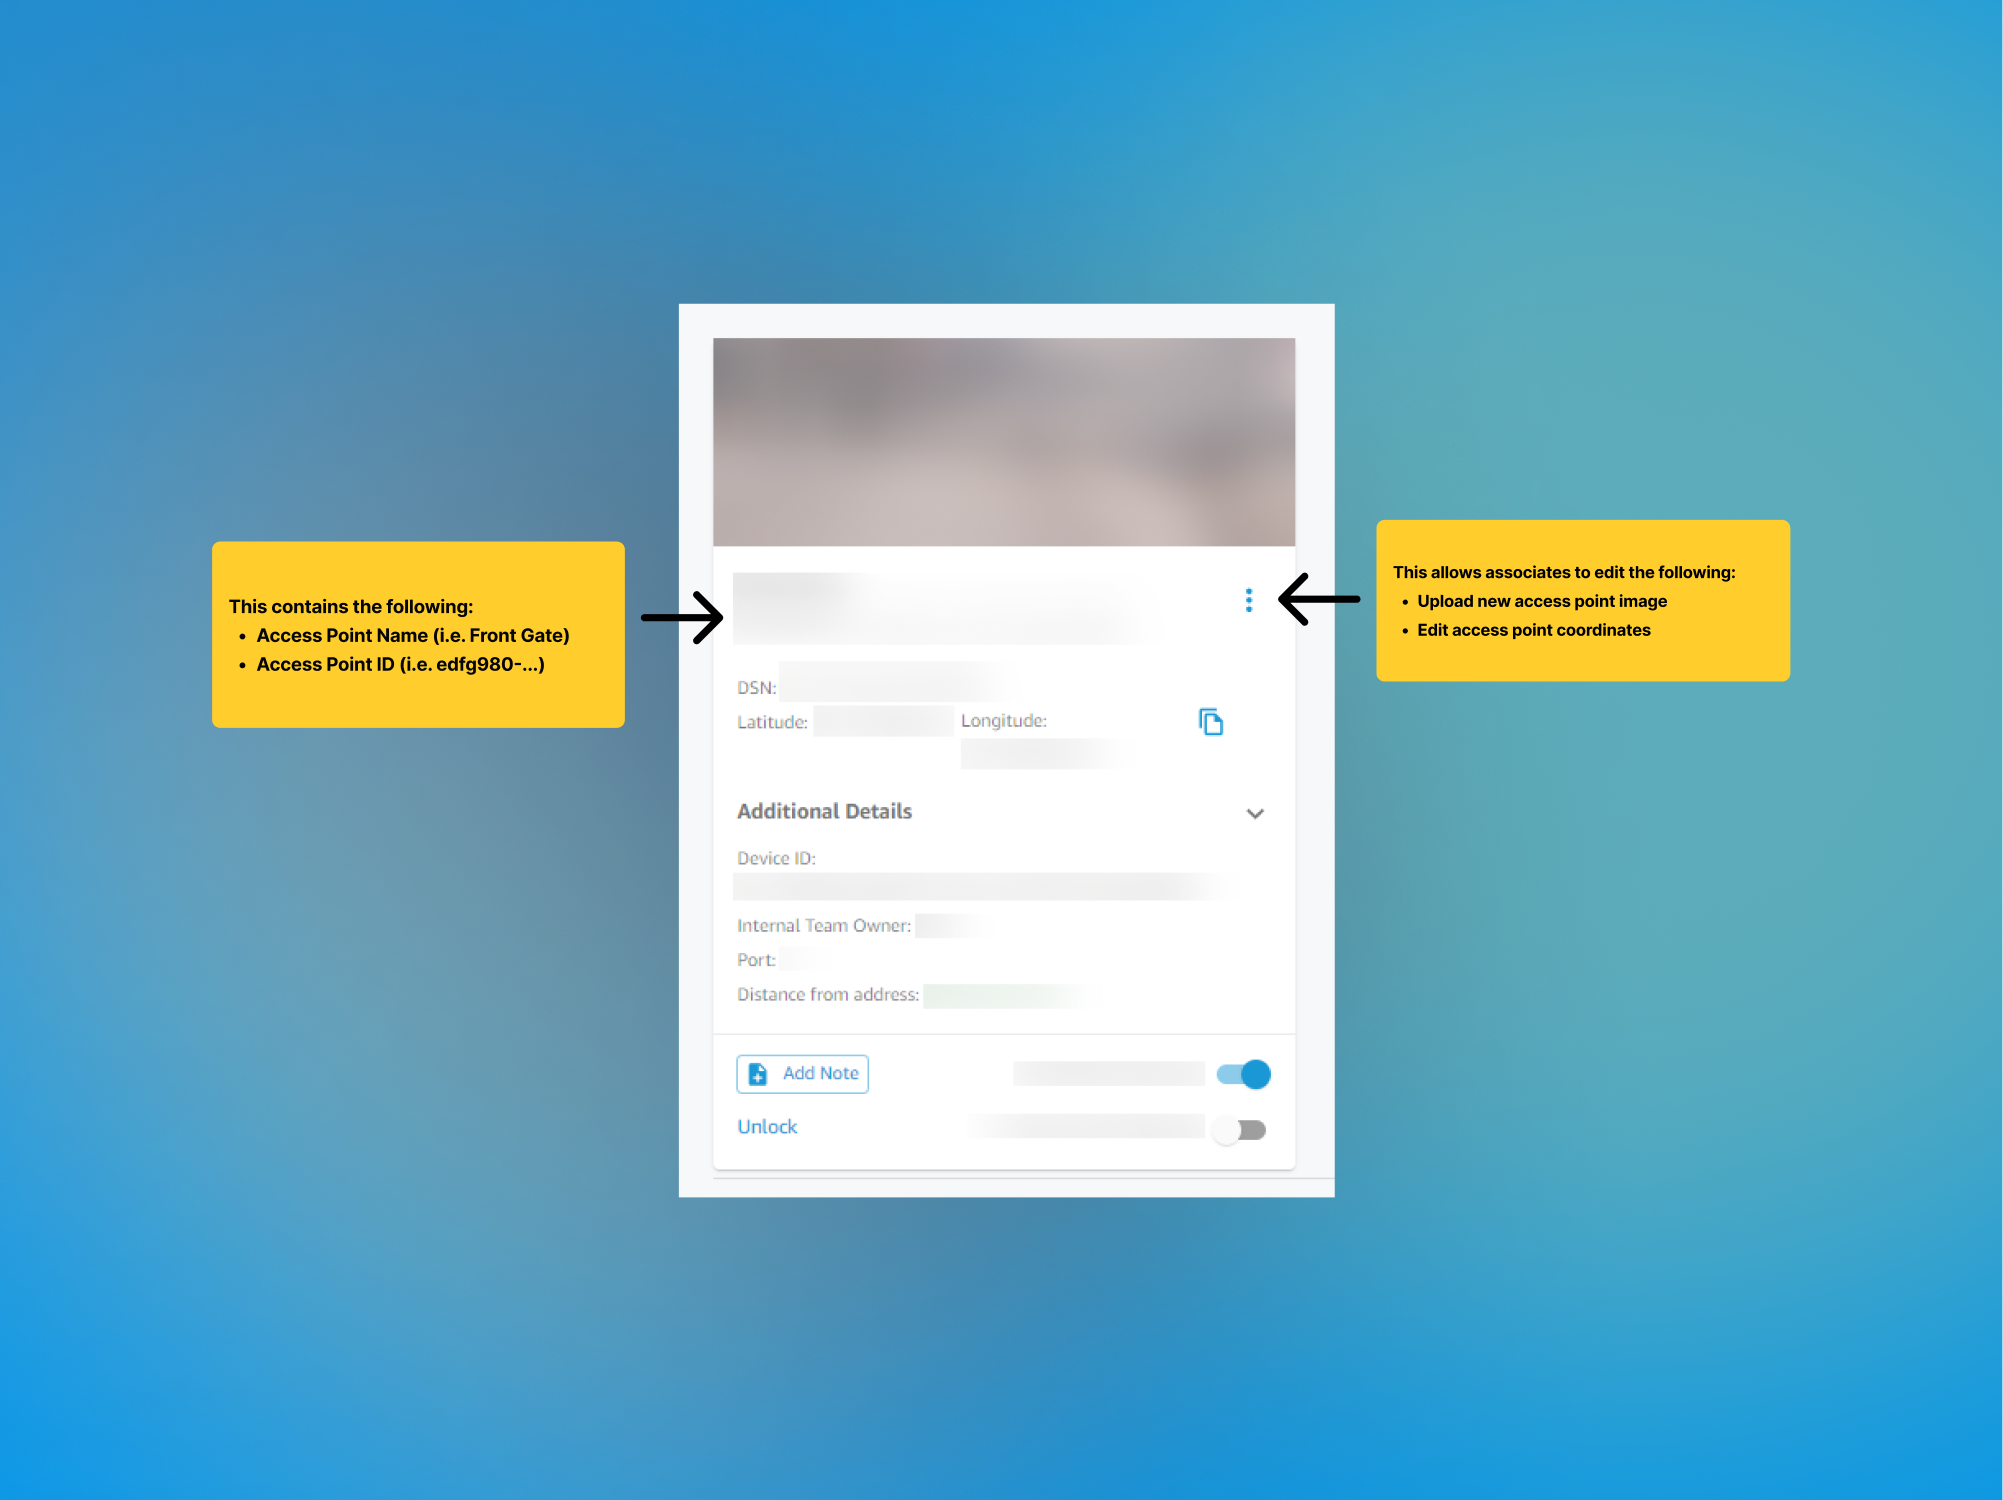
Annotated the existing card to show exactly where auditors were losing time, which fields were surfaced, buried, or irrelevant noise.
Formal interviews and informal conversations with associates across multiple teams revealed that device status wasn't just inconvenient. Multiple teams were making decisions without it.
Earlier iterations explored surface-level fixes to the Ops page, including a standalone search filter. Those directions addressed discoverability without fixing the underlying information hierarchy on the card itself.
When a Ring In integration request landed, I proposed we use it as an opportunity to redesign the underlying card, not just drop a new feature into a broken layout.
Multiple critique sessions stress-tested layout, hierarchy, and component decisions before final delivery to engineering.
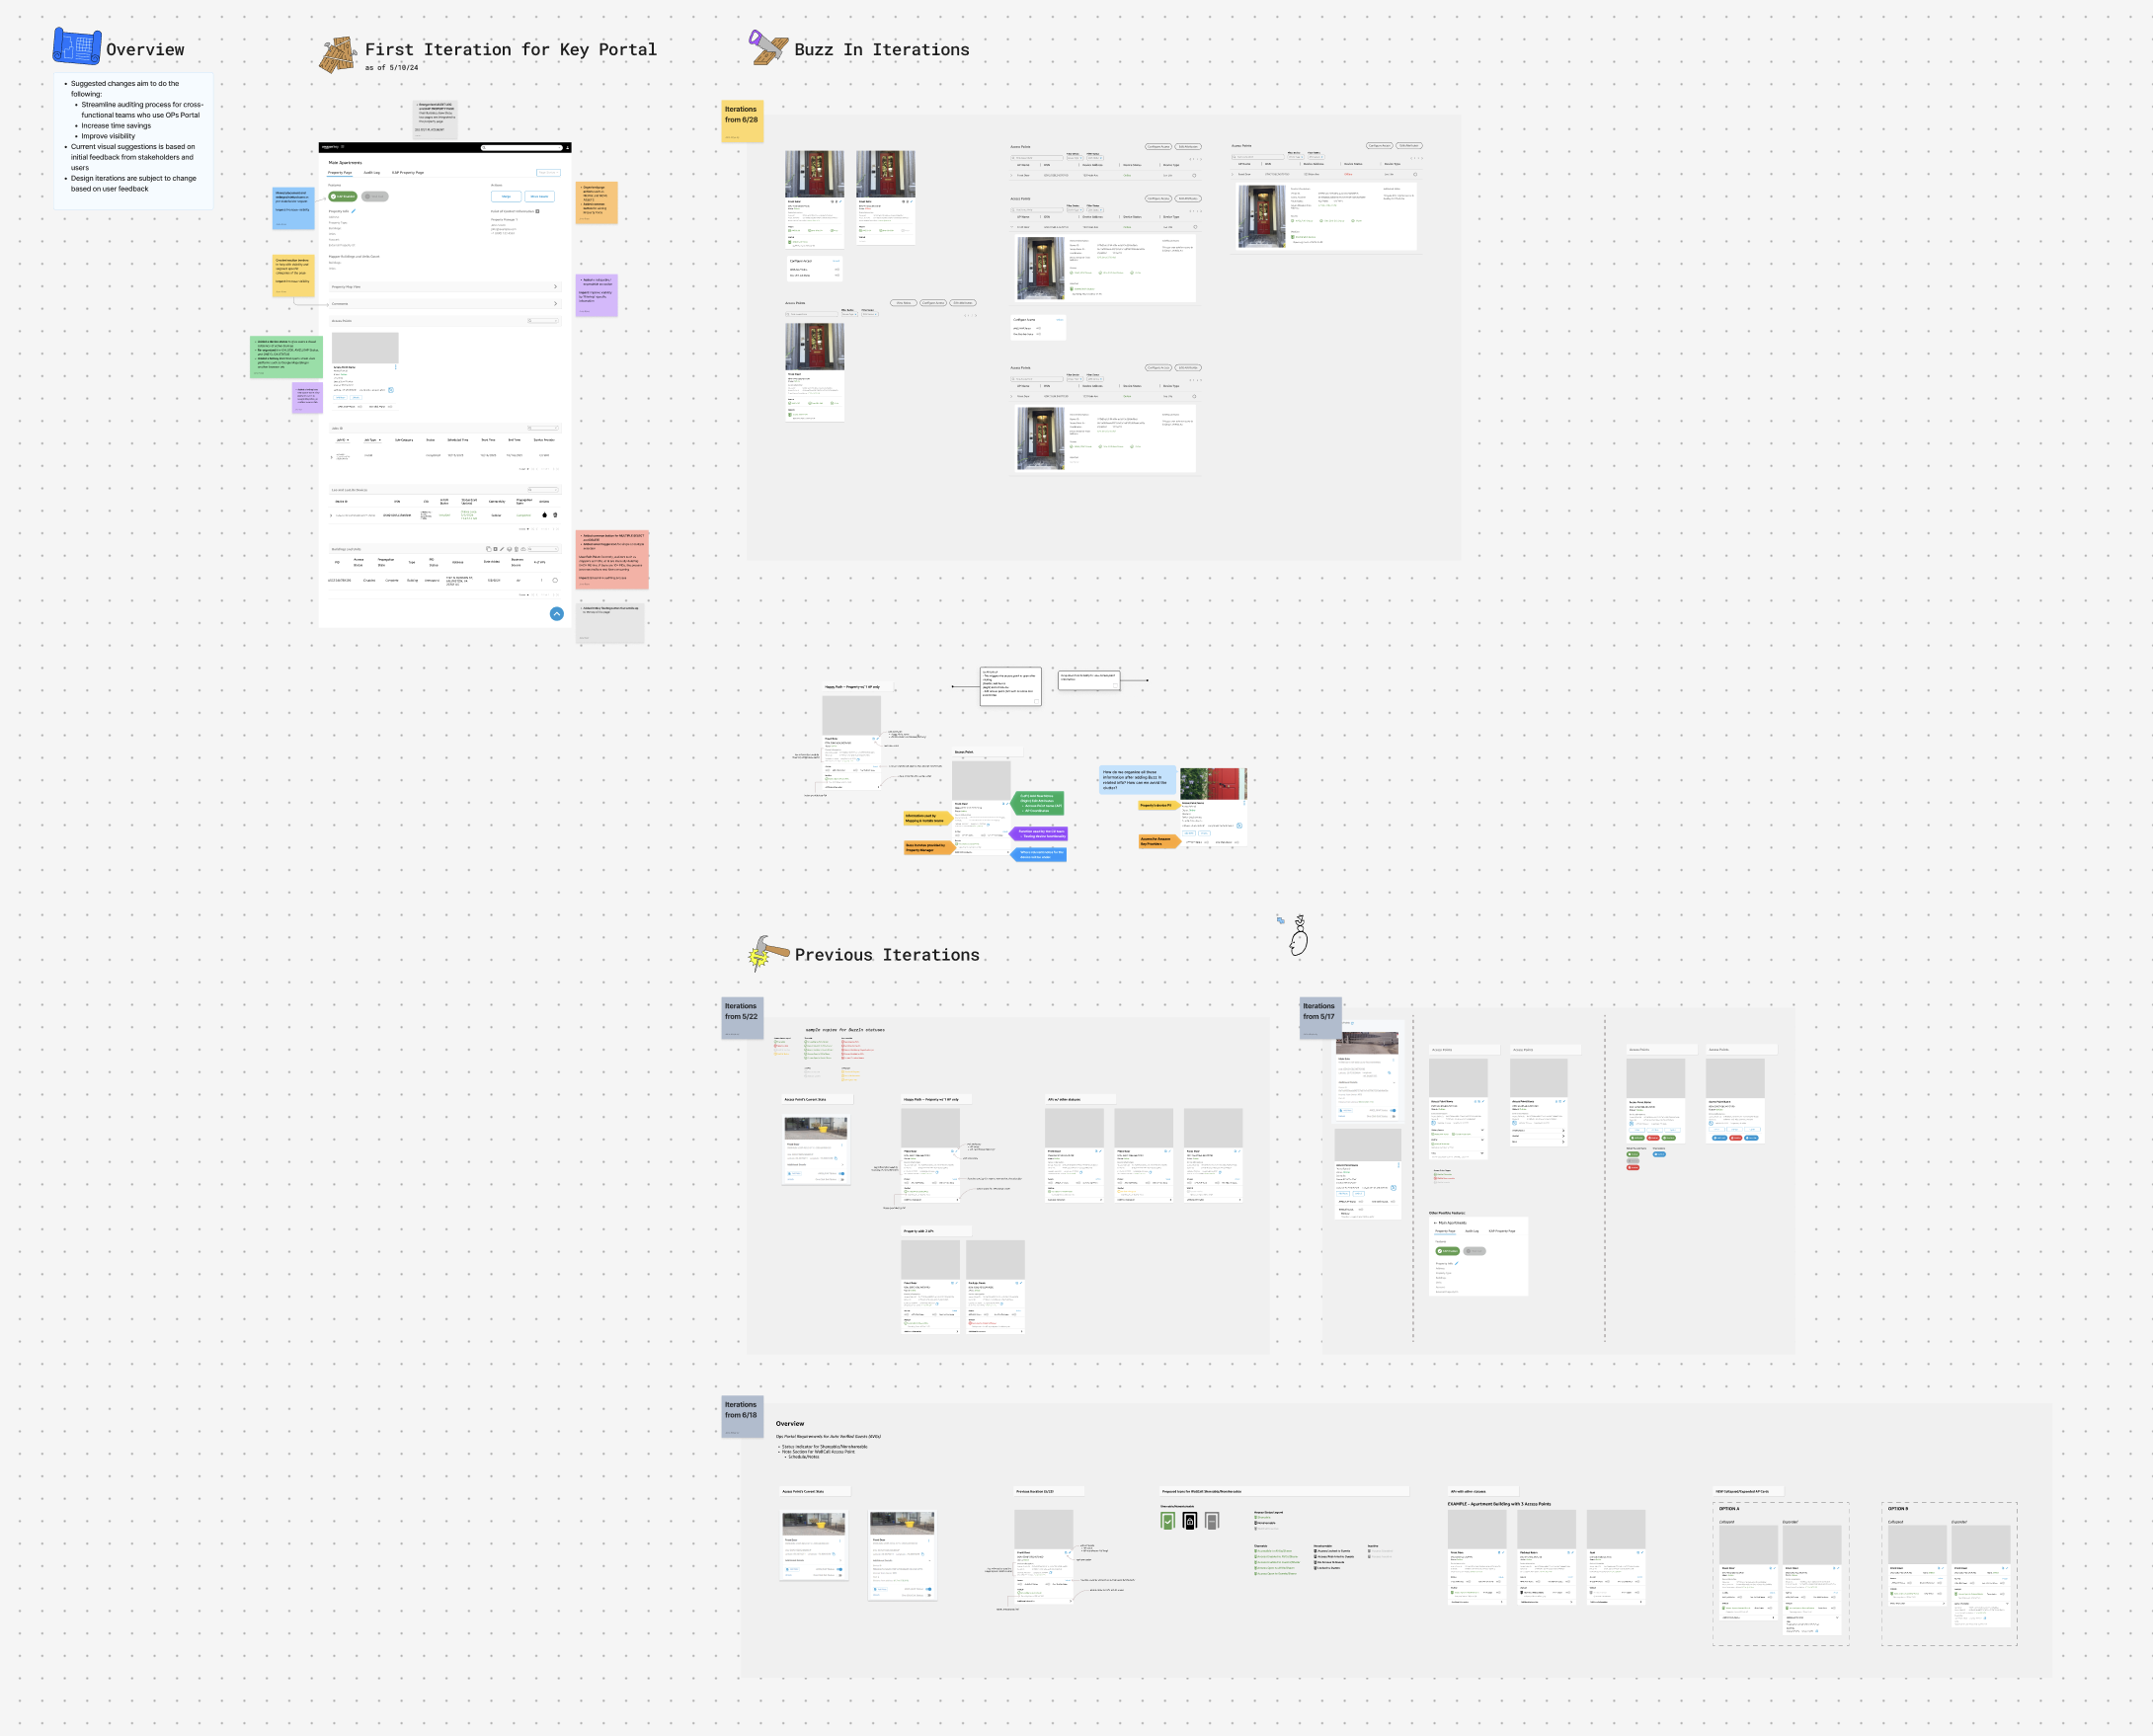
FigJam board presented to the PM, mapping where auditors were losing time and what earlier directions couldn't fix.
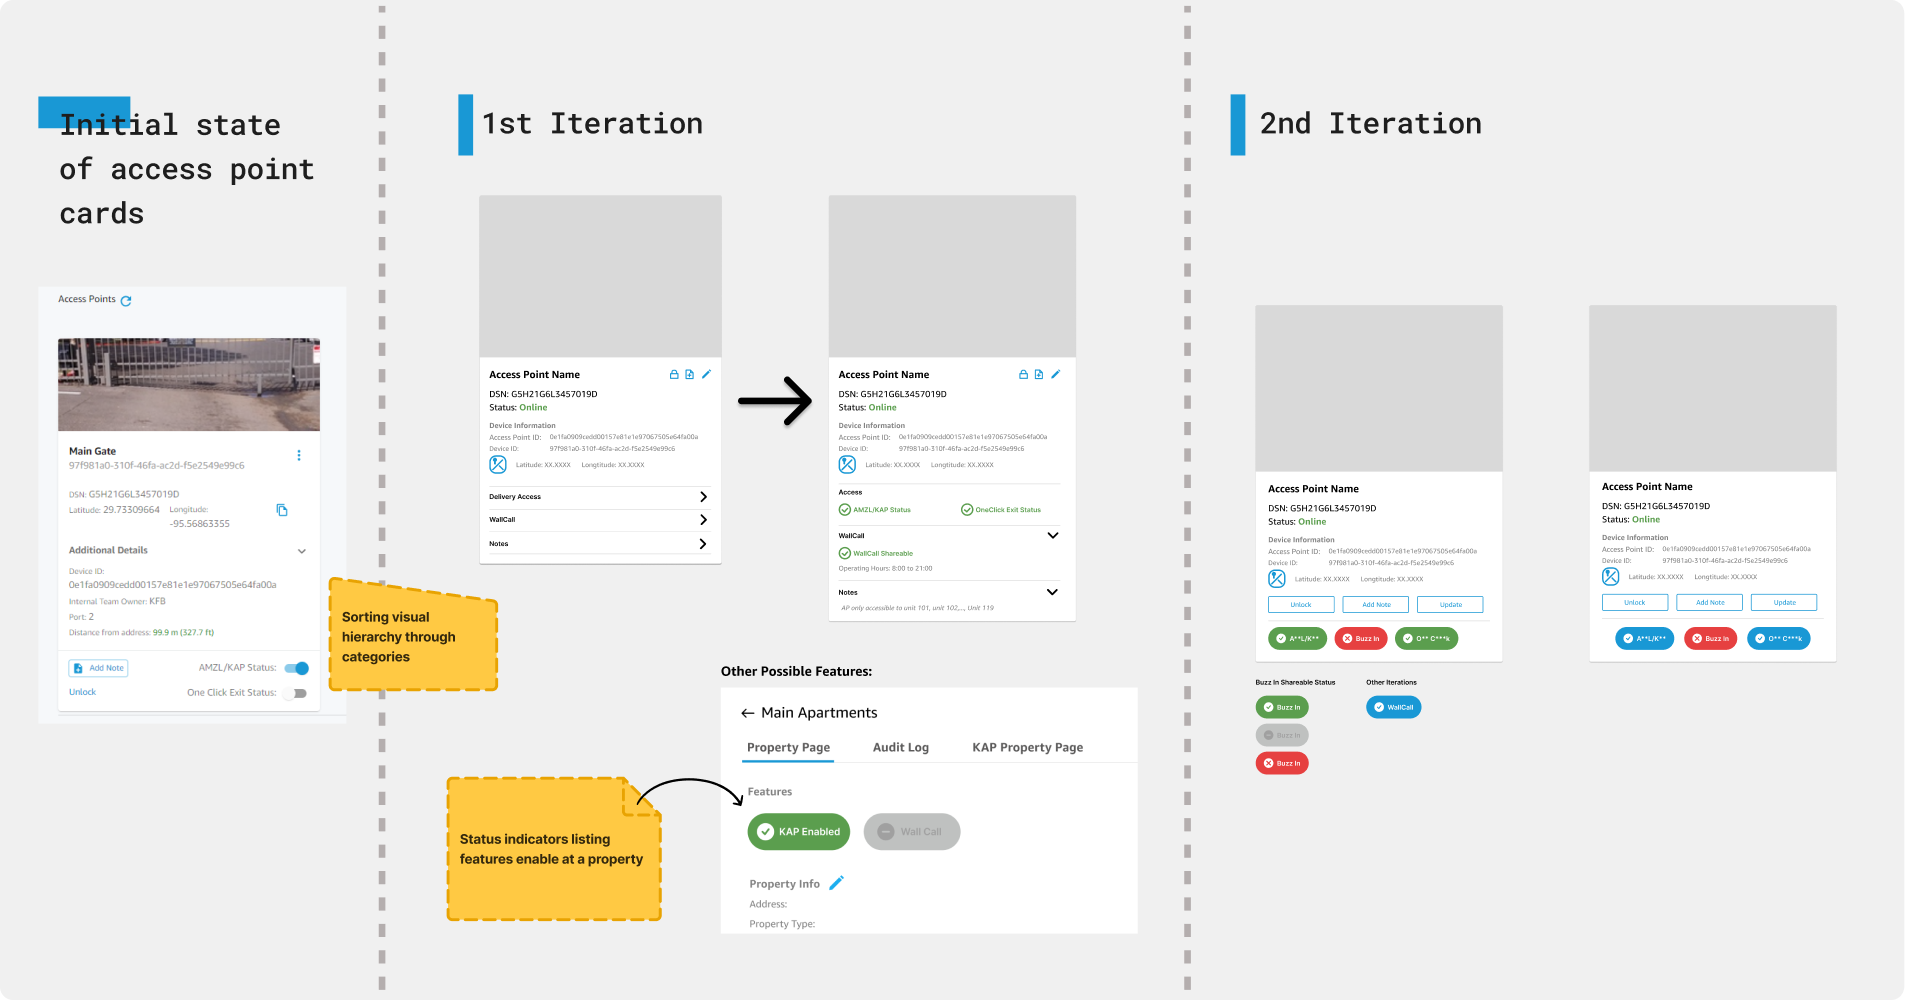
Earlier directions pressure-tested in critique sessions before landing on the final layout.
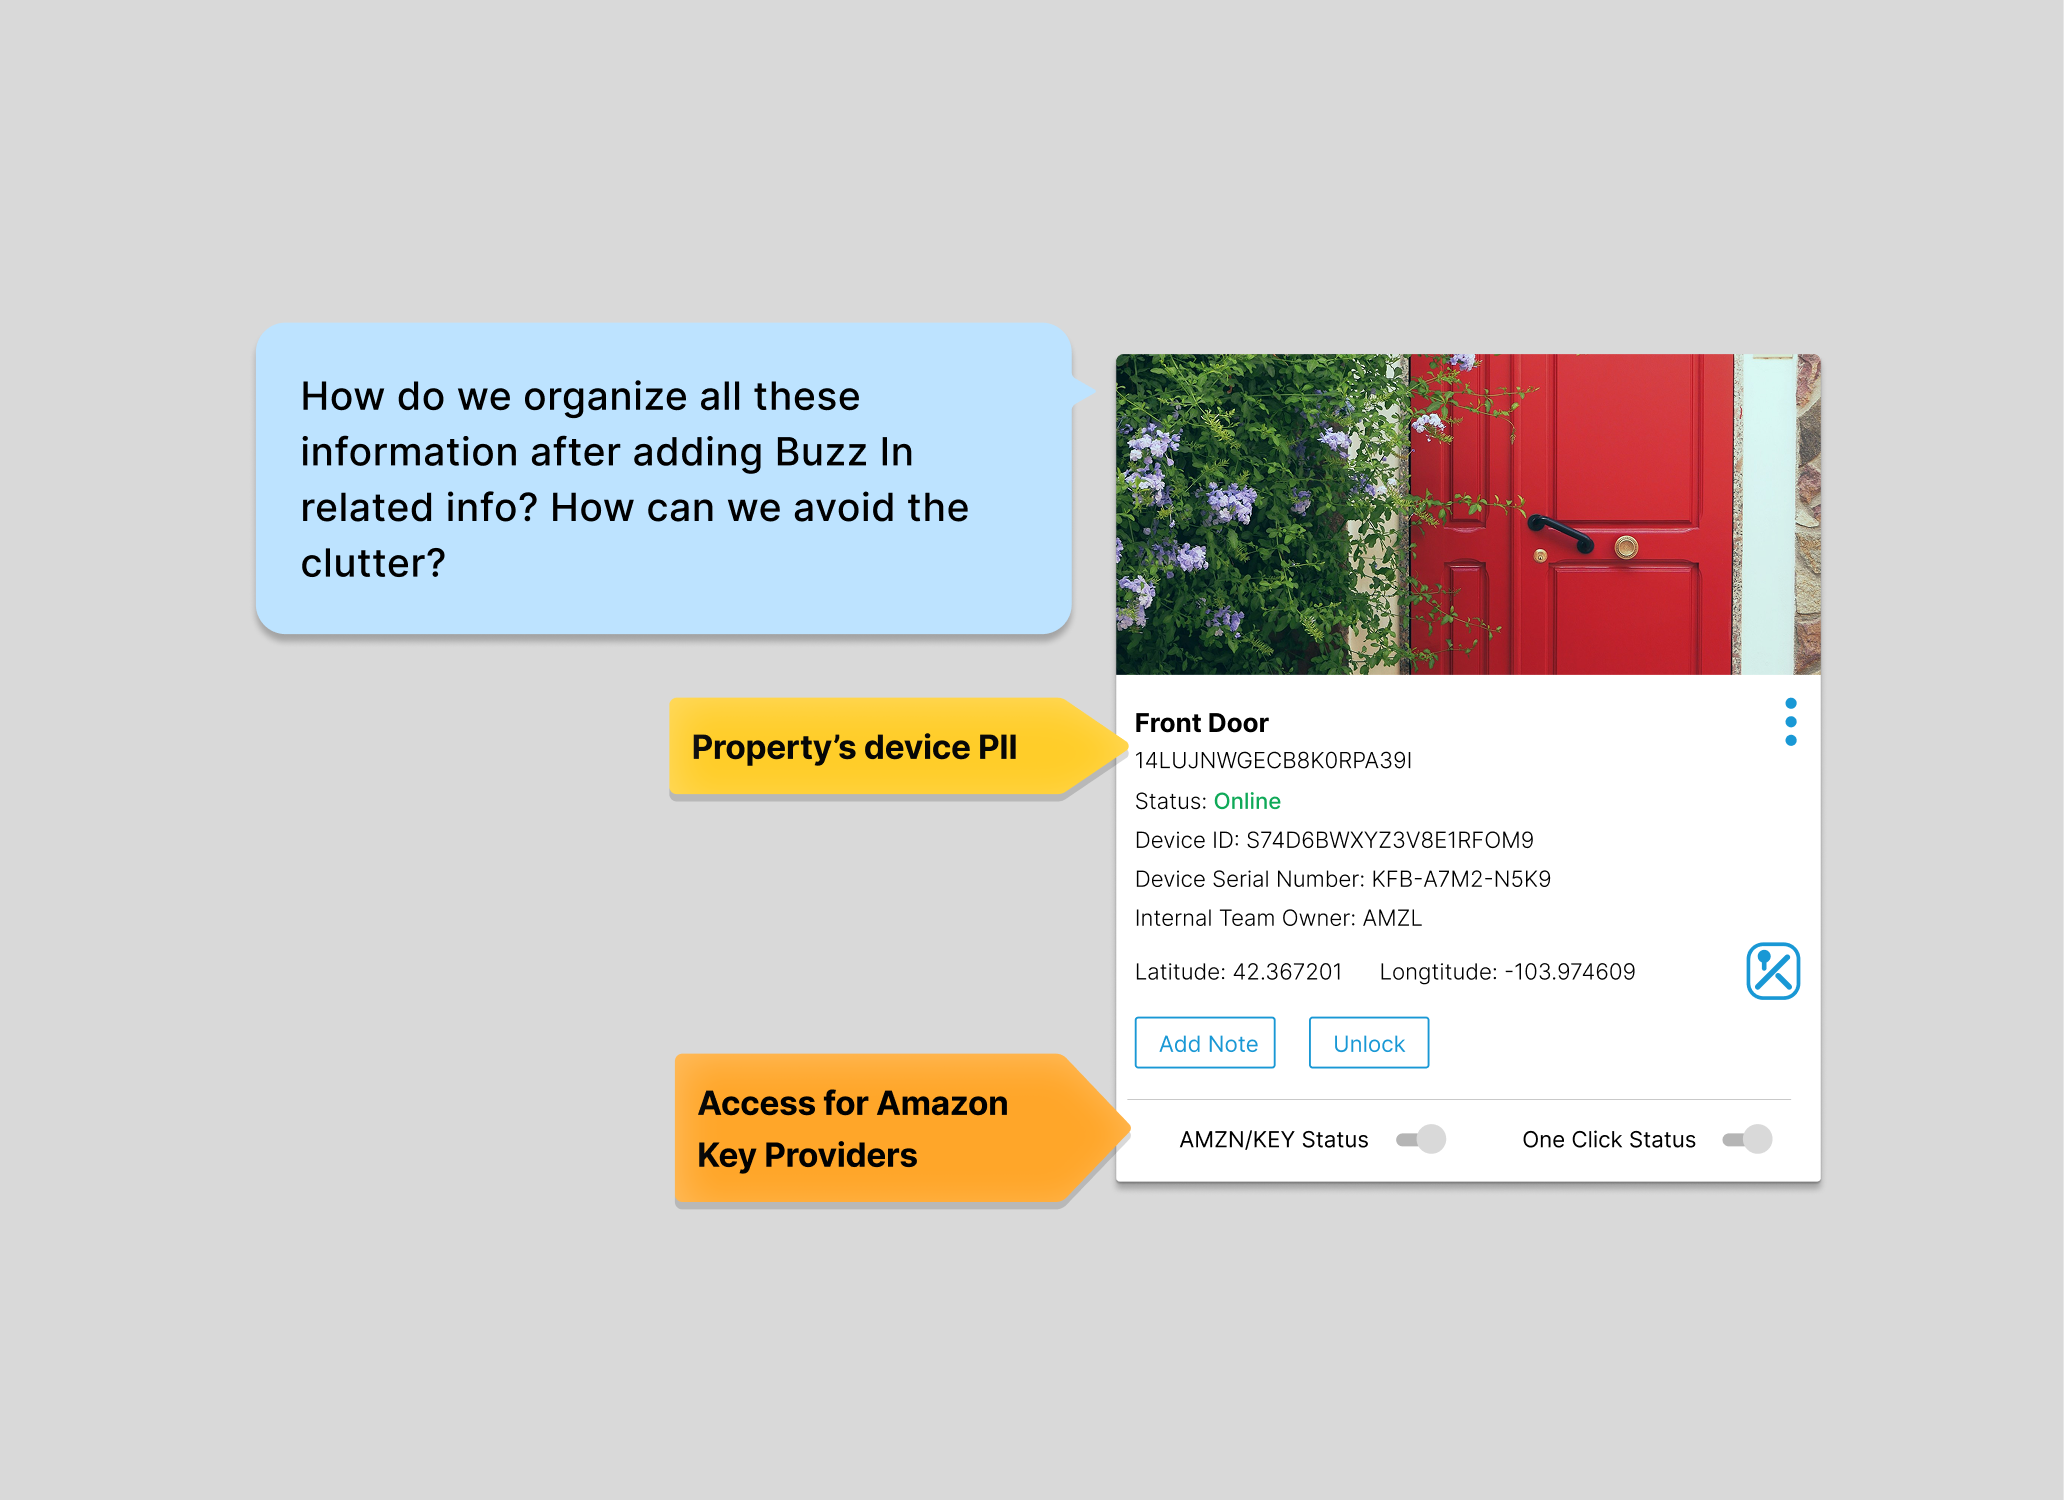
The original card, annotated. Device status missing entirely, the port field taking up space only one team used, and the information auditors needed buried behind the Additional Details toggle.
Three changes. Each one defensible.
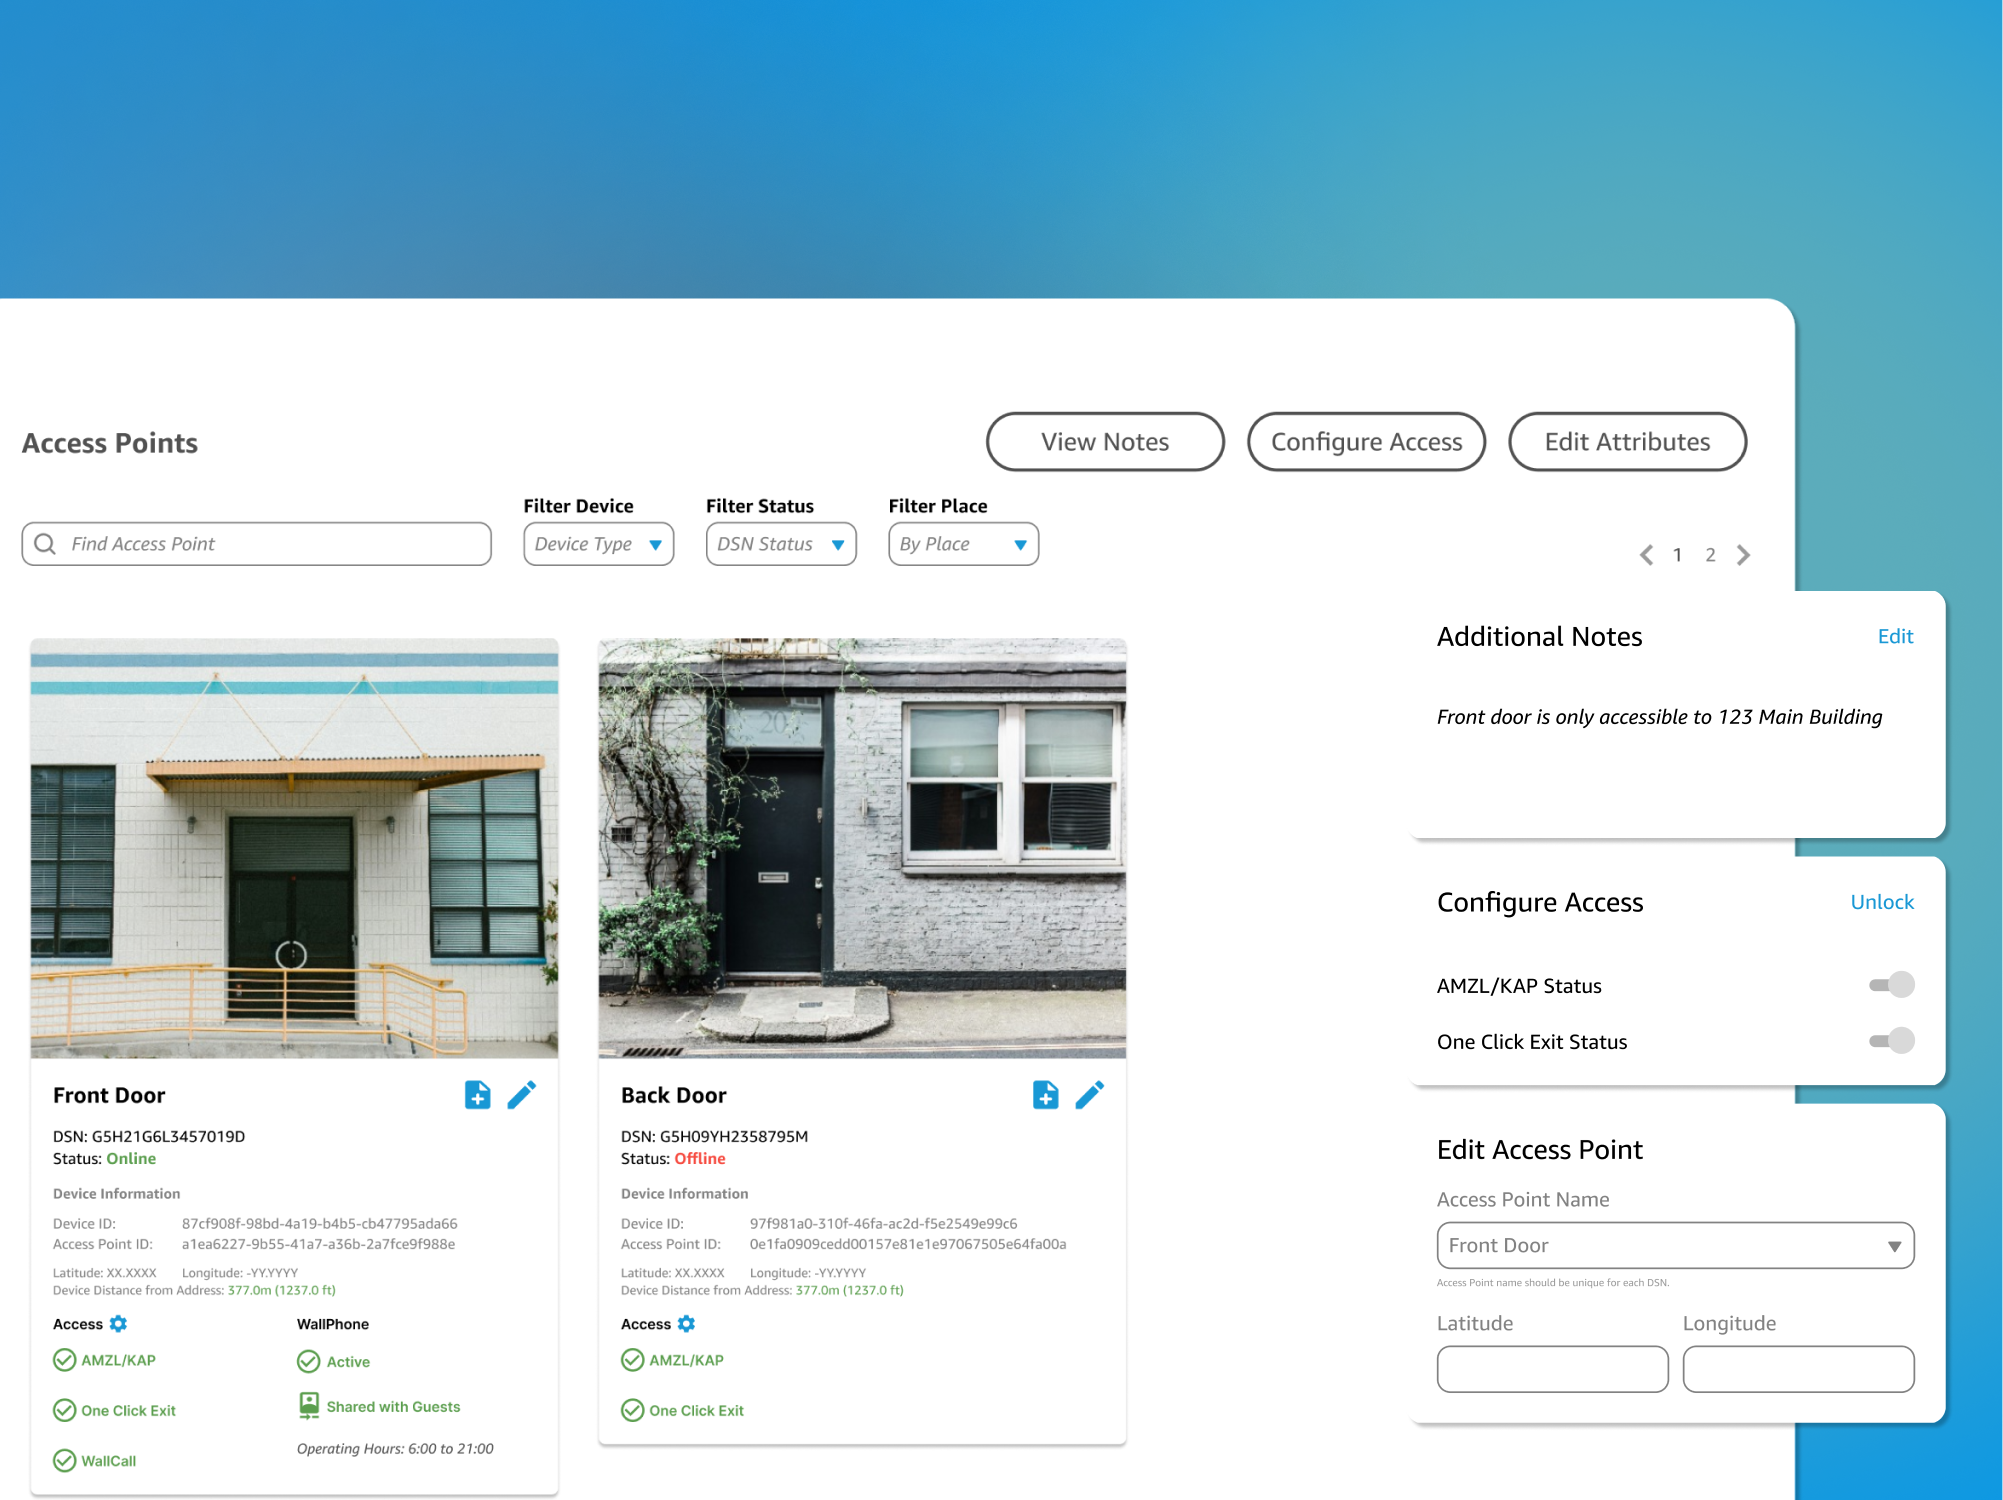
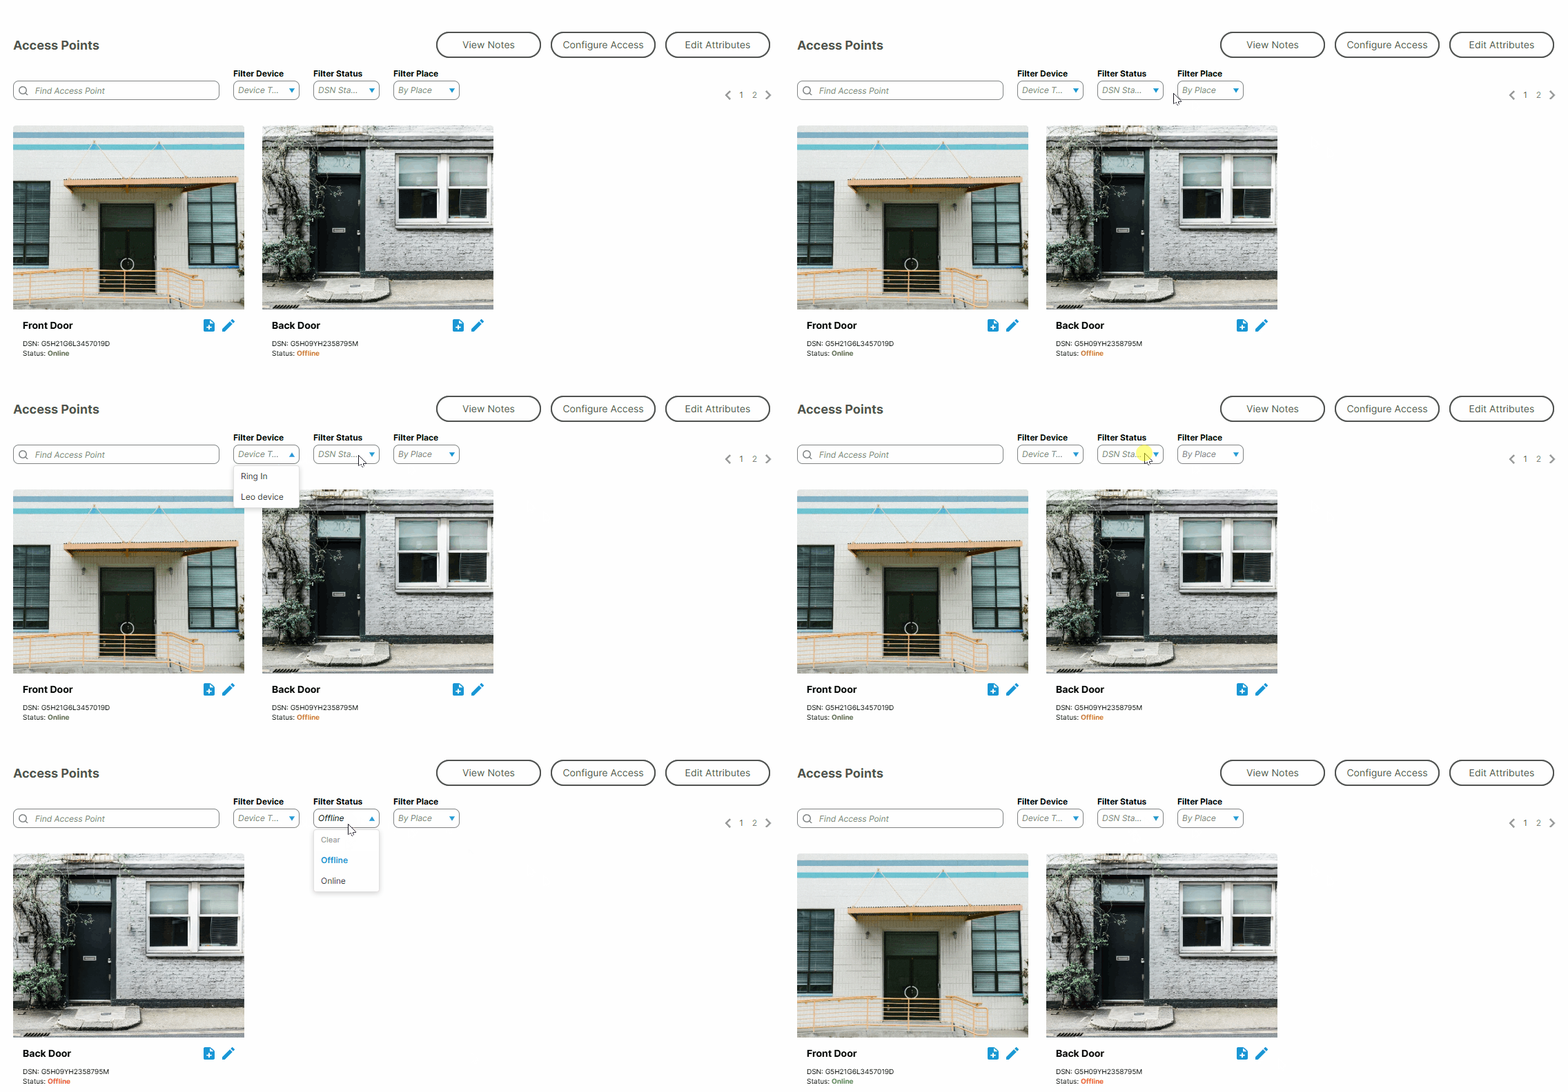 Filter bar with device, status, and place filters
Three filters, three roles. Each team filters by the dimension that matters to their audit.
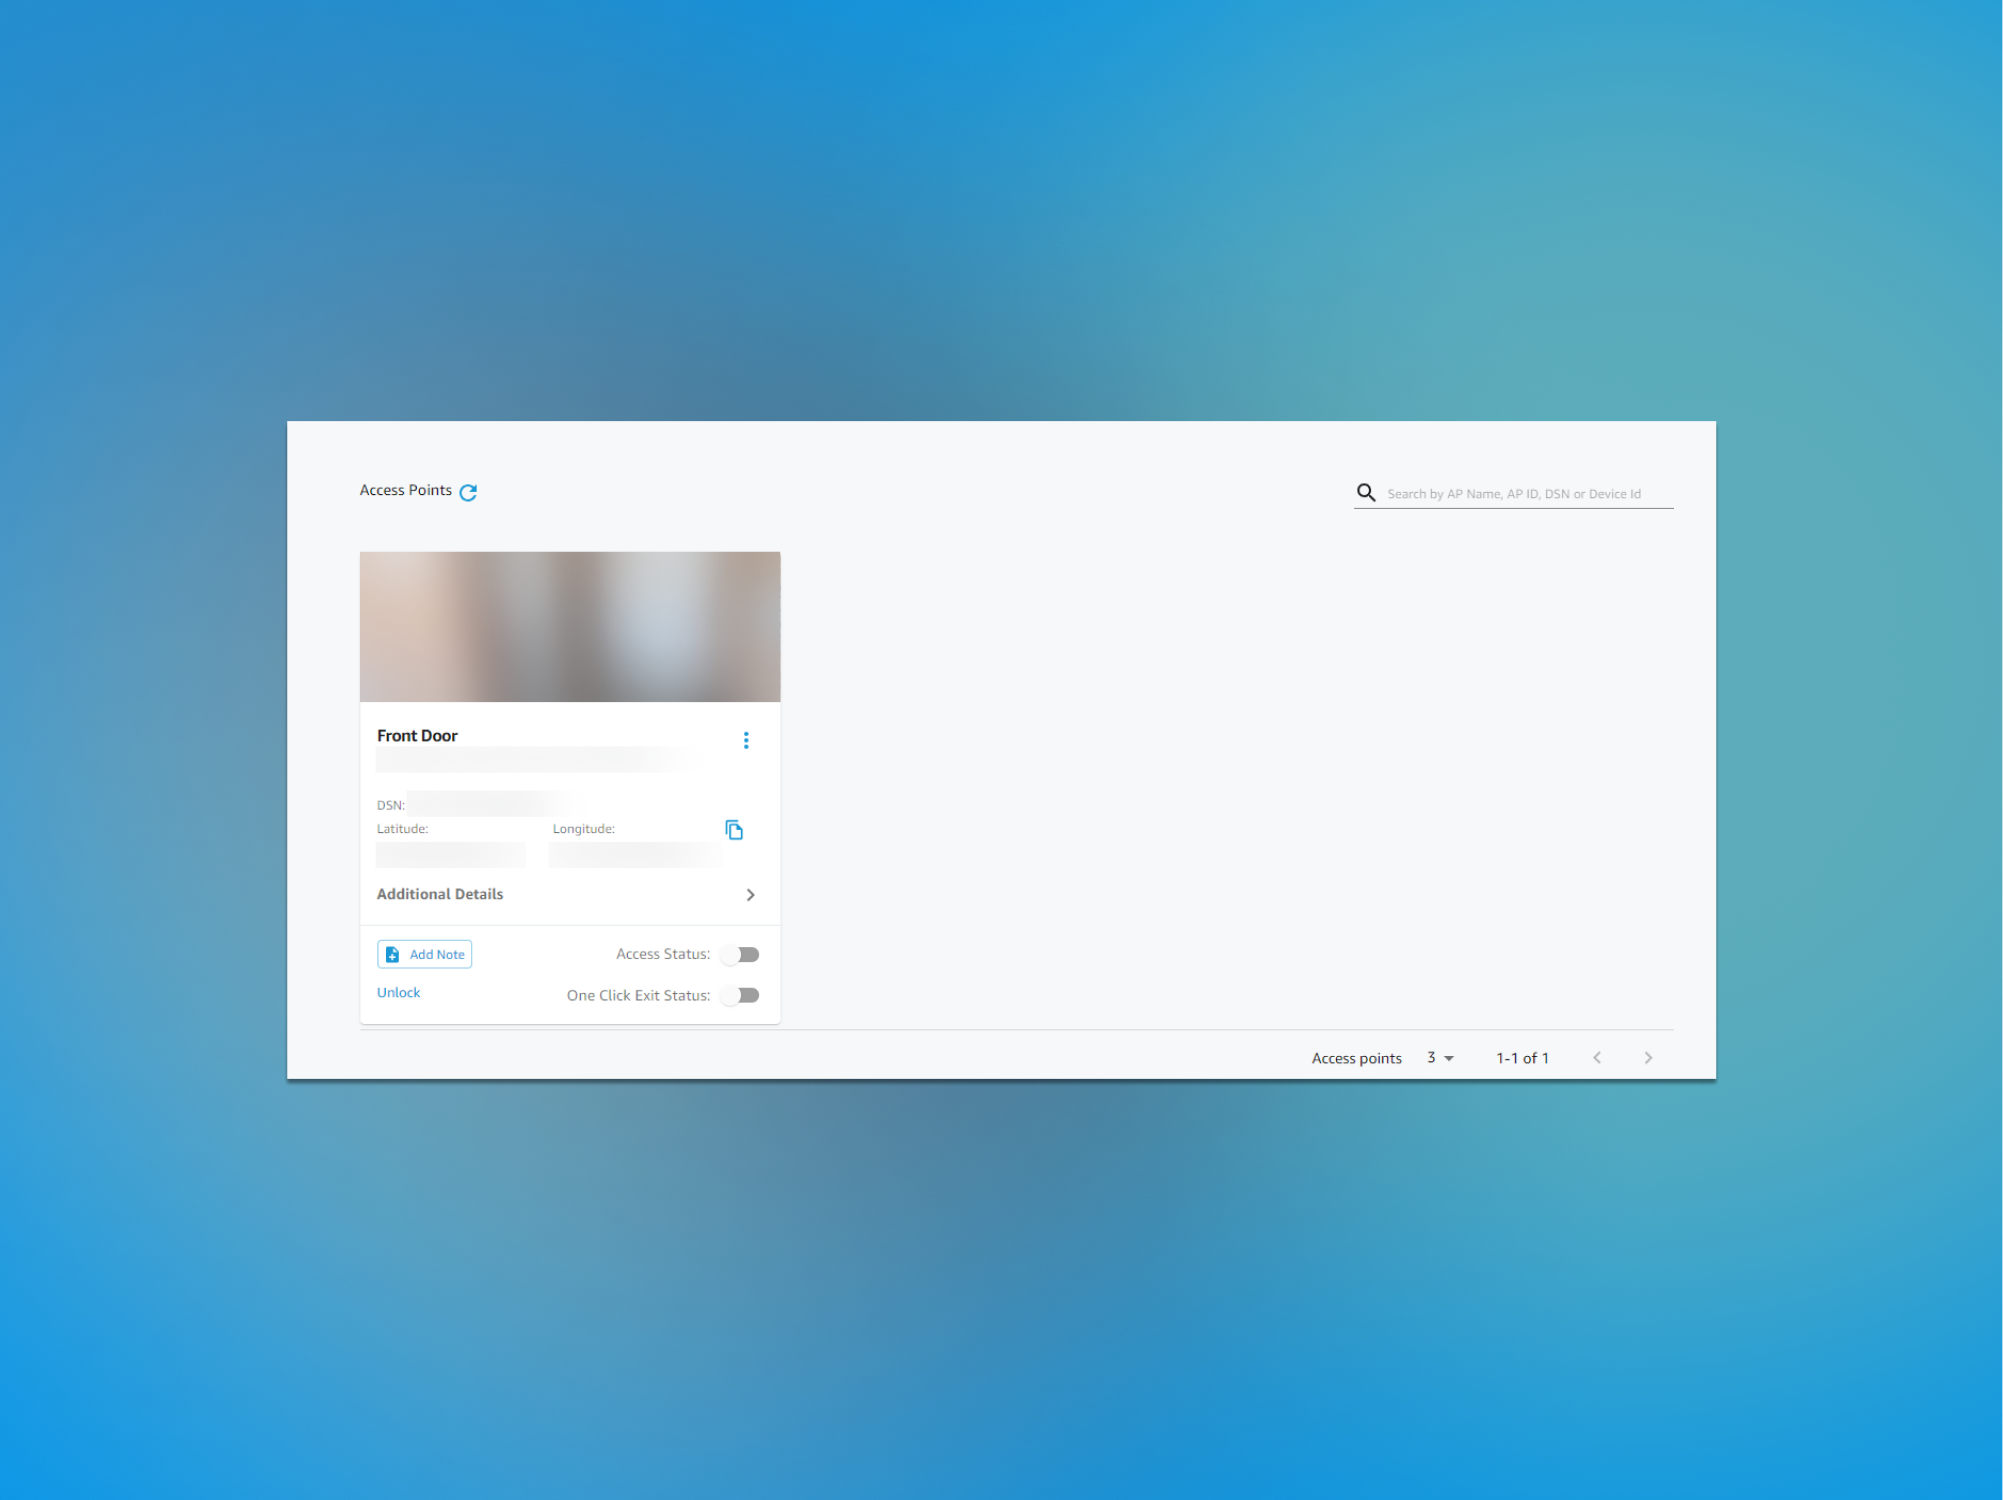
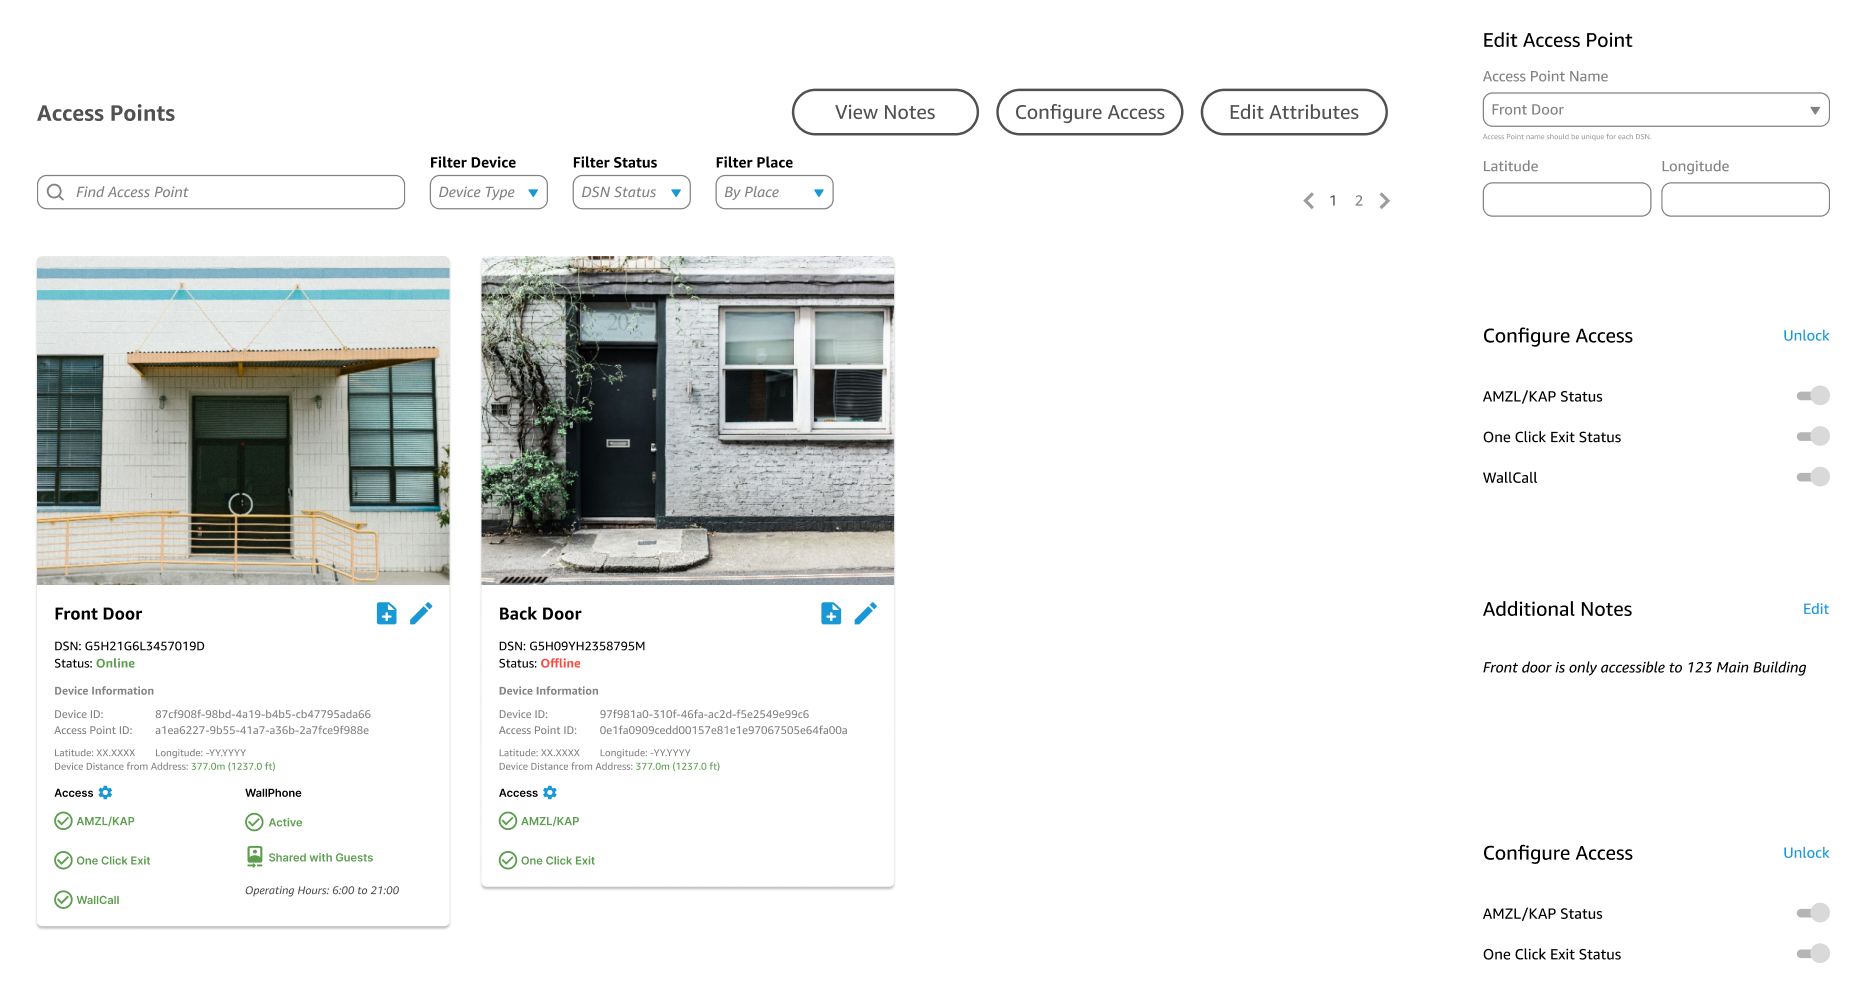
Same card, fewer clicks. Device status surfaced, port field removed, Additional Details toggle eliminated.
Hours recovered. Every day.
Across a team of 50 daily users, shaving 20 to 25 minutes per audit reclaims hundreds of person-hours per week. Properties that were stacking up in the backlog could move through mapping faster. Full adoption in 30 days, no training required.
The insight I missed until I was in the room.
The frequent context-switching and cognitive burden of remembering mid-audit state only became visible through observation, not research synthesis. A broader discovery phase would have surfaced cross-team collaboration friction earlier. The lesson: contextual inquiry in the actual environment, not just interviews about it.